
Vertica QuickStart for QlikView
To read this document in PDF form, click here.
The Vertica QuickStart for QlikView is a sample BI application implemented as a QlikView document (.qvw file) and powered by Vertica Analytic Database. The dashboards in the QuickStart present sample retail data for analysis. The QuickStart shows how retail companies could use Vertica and QlikView to quickly explore, visualize, and gain insight into their data stored in Vertica.
You can download the Vertica QuickStart for QlikView from the following location:
https://www.vertica.com/quickstart/vertica-quickstart-for-qlikview/
About the Vertica QuickStarts
The QuickStarts are posted for download on the Vertica QuickStart Examples page.
Note The Vertica QuickStarts are freely available for demonstration and educational purposes. They are not governed by any license or support agreements and are not suitable for deployment in production environments.
About QlikView
QlikView allows users to rapidly build and deploy analytic applications without the need for professional development skills. QlikView and Qlik Sense share the same engine and a number of core capabilities, but there are differences that reflect both advances in technology and the evolution of customer needs in the market. For details, see QlikView on the Qlik website.
Requirements
You can run the Vertica QuickStart for QlikView in static mode or in live mode. The requirements for installing and deploying the QuickStart depend on which mode you choose:
-
Static mode: QlikView stores data in the document file (.qvw).
In static mode, the QuickStart uses the VMart example data that was used to create it. You do not need a database connection to open the QlikView document, review the sheets, or drill down to detail data. The only requirement is QlikView Desktop 12.20 or later and the QuickStart.
-
Live mode: QlikView connects live to a data source.
In live mode, the QuickStart requires a connection to a Vertica database server with the VMart example database loaded. The connection requires the Vertica ODBC driver and a Windows DSN. Additionally, QlikView Desktop 12.20 or later and the QuickStart itself are required.
The QuickStart was created using QlikView for Windows version 12.20 (November 2017 SR4) 64-bit edition running on Windows 10 and Vertica Analytic Database version 9.0.1 running on Redhat Linux 7.4.
Installation and Setup
To install and start up the required components, follow these steps.
- Install the Vertica Database Server (Live Mode Only)
- Install the VMart Example Database (Live Mode Only)
- Install QlikView
- Install the ODBC Driver and Create a DSN (Live Mode Only)
- Download the QuickStart
Install the Vertica Database Server (Live Mode Only)
If you do not already have Vertica, you can download the Community Edition free of charge:
- Navigate to Vertica Community Edition.
- Log in or click Register Now to create an account
- Follow the on-screen instructions to download and install the Vertica Community Edition.
Install the VMart Example Database (Live Mode Only)
The Vertica QuickStart for QlikView assumes a default installation of the Vertica VMart example database.
To install VMart, follow the instructions in the Vertica documentation:
-
Installing and Connecting to the VMart Example Database
Note By default, the VMart installation generates data for years 2003 thru 2007. This QuickStart document is based on a VMart database with data for years 2012-2016. If you want your VMart database to match those dates:
- Perform an Advanced Installation.
-
When you come to the instructions for running the sample data generator under Step 1: Setting Up the Example Environment , run vmart_gen with the --years option as shown:
./vmart_gen --years 2012-2016
For details about VMart, see VMart Example Database Schema, Tables, and Scripts.
Install QlikView
QlikView runs on Windows desktop platforms. If you do not have QlikView, you can download and install a free version as follows:
-
Navigate to the QlikView page on the Qlik website:
- Click Try it Free.
- Download the QlikView installer that is compatible with your Windows architecture (32- or 64-bit).
- Start the installer.
- Follow the prompts to install QlikView.
Note Caution for QlikView Personal Edition Users.
Install the ODBC Driver and Create a DSN (Live Mode Only)
QlikView uses ODBC to connect to Vertica and a DSN to connect to the VMart example database. The ODBC driver for Vertica is part of the Vertica client package.
Download and Install the Vertica Client Package
- Navigate to http://www.vertica.com/resources/vertica-client-drivers/.
- Download the Vertica client package that matches the architecture of your operating system (32- or 64-bit) and your version of Vertica database.
- As Windows Administrator, launch the installer and follow the prompts to install the Vertica client.
Note Vertica drivers are forward and backward compatible. You can connect to the Vertica server using earlier or later versions of the client. For more information about client and server compatibility, see the Vertica documentation.
Create a DSN Connection to the VMart Example Database
Depending on the architecture of your operating system and the QlikView application that you downloaded, create a 32- or 64-bit DSN connection. To create the DSN:
-
From the Windows Start menu, click Run.
-
Type this text:
ODBC Data Sources
-
Select the appropriate application for your operating system architecture.
For details, see Setting Up an ODBC DSN in the Vertica documentation.
Download the QuickStart
- Navigate to vertica.com/quickstart
- Select Vertica QuickStart for QlikView.
- Log in or create an account.
- Click Download.
Open the QuickStart
- Navigate to the folder where you downloaded the compressed file and extract the contents.
-
Place the QuickStart file in the default QlikView applications folder. On Windows, the default QlikView apps location is:
C:\Users\dbadmin\Documents\Qlik\View\Apps
-
Launch QlikView from the Start Menu.
Caution If you are using the free Personal Edition of QlikView, see Caution for QlikView Personal Edition Users.
- On the QlikView Start page, go to File > Open and navigate to the folder where you extracted the QuickStart VMart_quick_start.qvw file.
- Select and open VMart_quick_start.
Caution for QlikView Personal Edition Users
The free personal edition of QlikView limits the number of times you can open a qvw file. You can open the QuickStart qvw file up to 4 times. Each time, when you attempt to open the file, the following message displays:
The Personal Edition key file is missing or corrupt. QlikView will recreate your Personal Edition key from the document you are about to open. WARNING: This could render documents with different or newer keys unusable. Proceeding with this operation will use up one of your n remaining recovery attempts. Continue opening file?
To open the QuickStart qvw file, click Yes then click Continue.
If you attempt to open the qvw file more than 4 times, QlikView displays this message:
Your installation of QlikView has exceeded the maximum number of document recoveries allowed for a Personal Edition license. To continue using QlikView you will need to purchase a full QlikView license.
Connect to Vertica (Live Mode Only)
- Make sure that you have created a DSN as described Install the ODBC Driver and Create a DSN (Live Mode Only).
- Follow the steps in Open the QuickStart, and note the Caution for QlikView Personal Edition Users
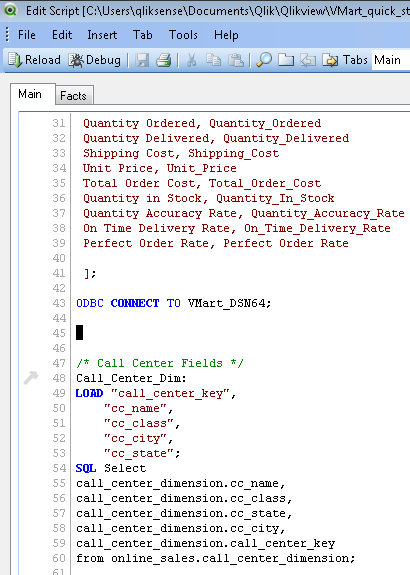
- Go to File > Edit Script.
-
In the Edit Script window, replace the connection information with your specific Vertica VMart database information. To edit the connection information, locate the following line on the Main page and on the Facts page and replace VMart_DSN64 with the DSN that you previously created.
ODBC CONNECT TO VMart_DSN64
You can easily make this edit by clicking Connect.
- In the Connect to Data Source dialog box, select the appropriate bitness and the DSN connection that you previously created.
- Enter the user name and password for the DSN. If the user name and password are included in the DSN, leave these fields blank.
- Click Test Connection.
- Click OK.

- Click Reload on the left hand side of the screen.
QlikView executes the script to load the data.
- When the script completes, click Close.
- Click OK to close the Sheet Properties dialog box.
About the QuickStart Dashboards
The QuickStart dashboards present sample business and operational data that a large retail chain might track over time. The chain operates brick-and-mortar stores and an online marketplace. It sells a wide variety of products that it purchases from different vendors.
Note The data in your dashboards will not match the data in the screen shots in this document. This is because the VMart data generator generates data randomly.
Some Features of the User Interface
The QuickStart user interface supports several mechanisms for interacting with the dashboards. Some of them are described in the following topics.
Additionally, you can mouse over elements of the display to show descriptive text.
-
Work with Individual Panes
Each dashboard contains a set of panes that can be individually maximized, minimized, printed, or exported to Excel. Icons for each of these operations appear in the upper right corner of each pane.
-
Drill Up or Down in the Data
A small up arrow at the bottom of a pane is labeled indicating the level of the aggregated data displayed. Click a data element to drill to the next level in the hierarchy. For example, if you click the data labeled Medical, the display changes to show the categories of medical data that are available. To return to the aggregate level above the current one, click the small up arrow.

-
Lock the Data Selection
You can lock or unlock the filters that you set on the data. When locked, the filters remain in effect and can't be changed until you unlock them. A menu above the dashboards provides the Lock and Unlock operations, arrows for returning to an earlier data selection, and a Clear operation to clear all filters and reload the data. Note that if an unlocked filter is active the sheet tabs will show a green circle; if a locked filter is active, then the circle will be blue.
-
Filter Behavior
Filters chosen on any sheet impact all other sheets using that same field. For this QuickStart we've locked filter choices for consistency across the sheets. Make sure to revert back to default any filters you may change during exploration of any of the sheets. Otherwise you may get some blank graphs on other sheets.
Executive Dashboard
The Executive Dashboard presents a high-level view of the business data that is shown in greater detail in the other dashboards. You can use this dashboard to analyze the overall functioning of the business over time.
In this instance, we are viewing sales_dollar_amount for 2015 and 2016. You can clearly see that the general pattern of returns closely tracks the general pattern of sales for both online and store sales in both years.

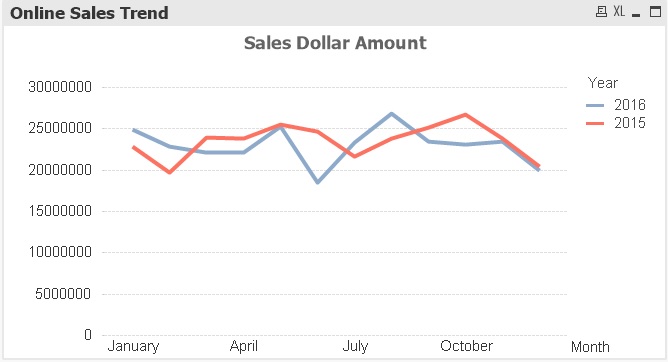
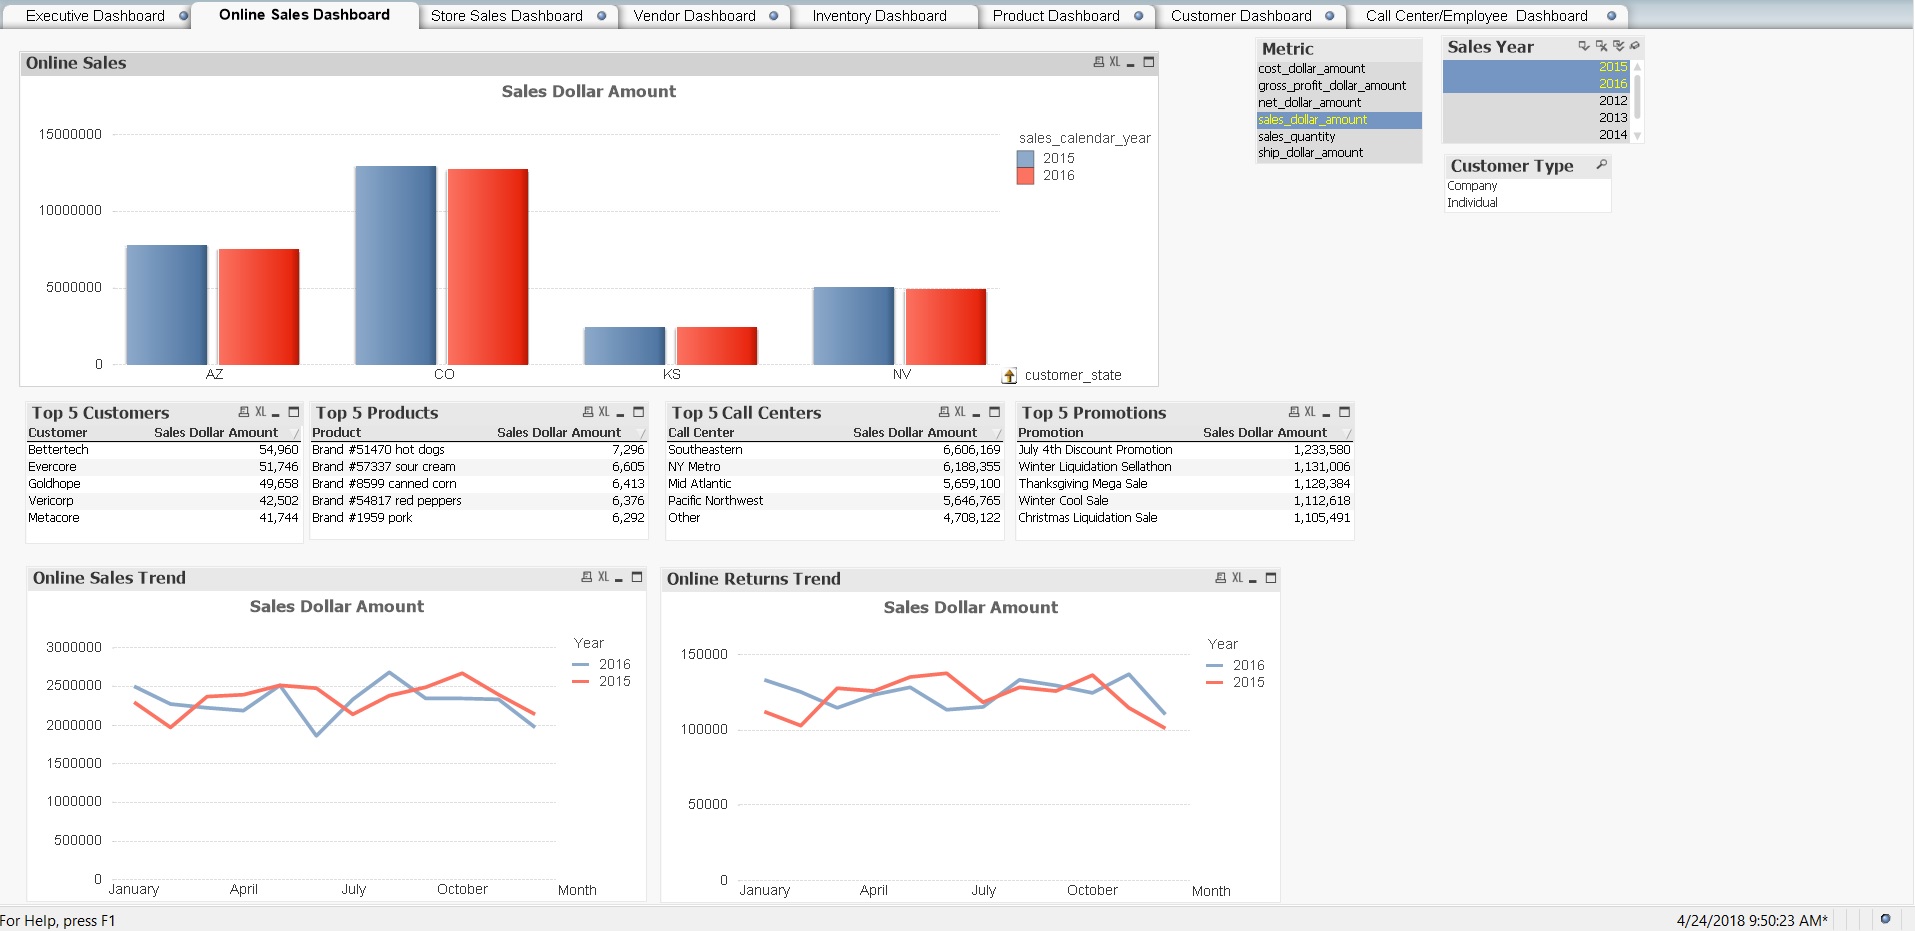
Online Sales Dashboard
The Online Sales Dashboard presents an overview of the online business. In this instance, we are viewing sales to individual customers in 2015 and 2016. The data is displayed by region.
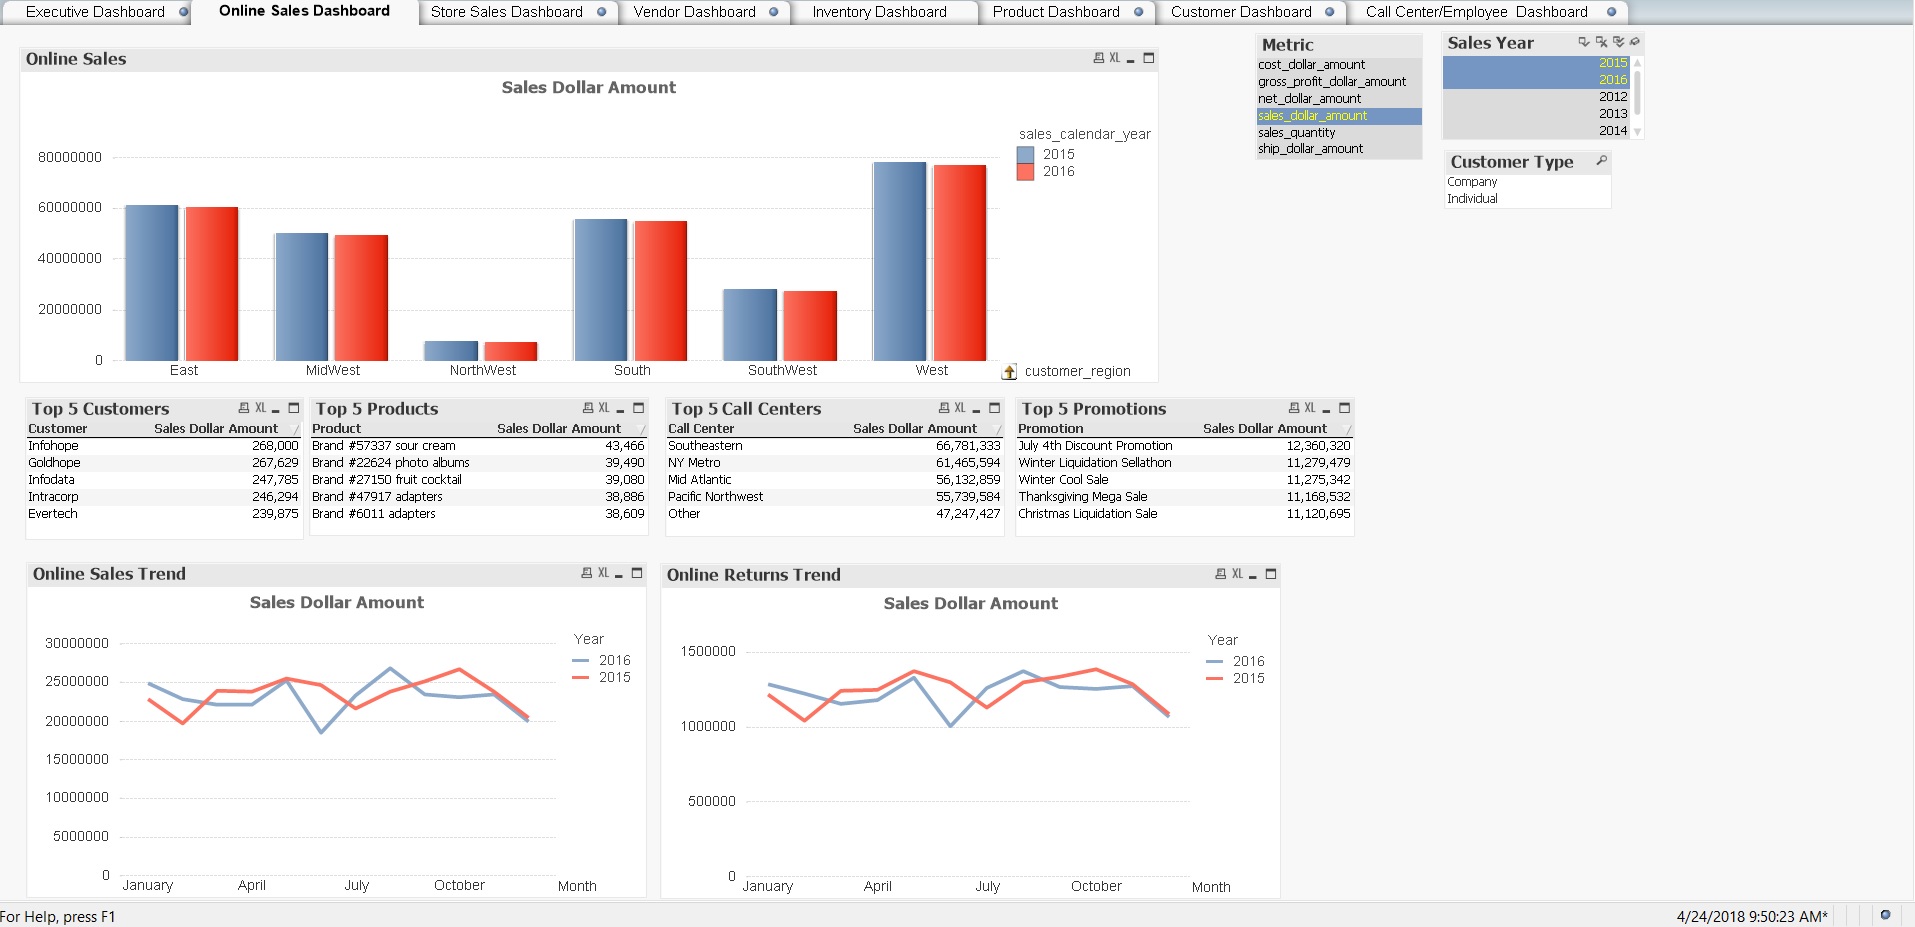
Click the arrow beneath the bar graph to view the data for individual states. If you click the arrow and then click SouthWest, you will see the data for the states in the SouthWest sales region: Arizona, Colorado, Kansas, and Nevada.
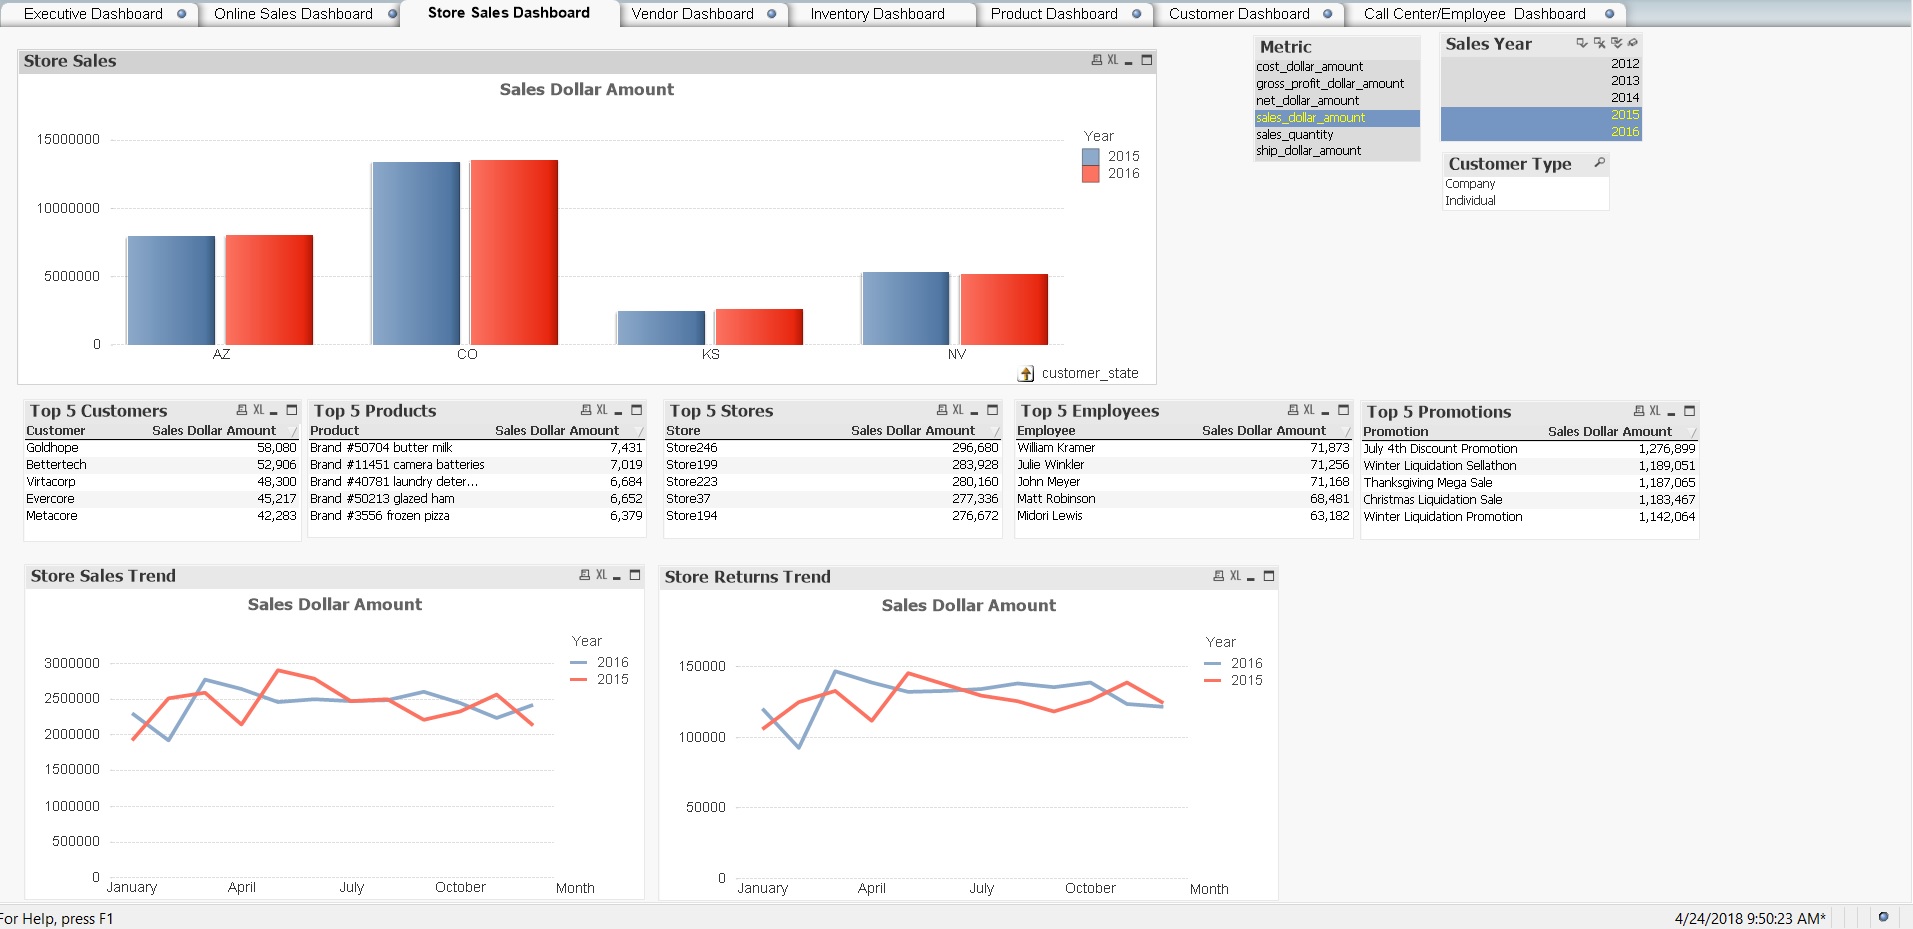
Store Sales Dashboard
The Store Sales Dashboard presents an overview of sales for business conducted in stores. In this instance, we are viewing sales to individual customers in 2015 and 2016.
The dashboard presents the data by region and includes the top 5 customers, products, stores, employees, and promotions.
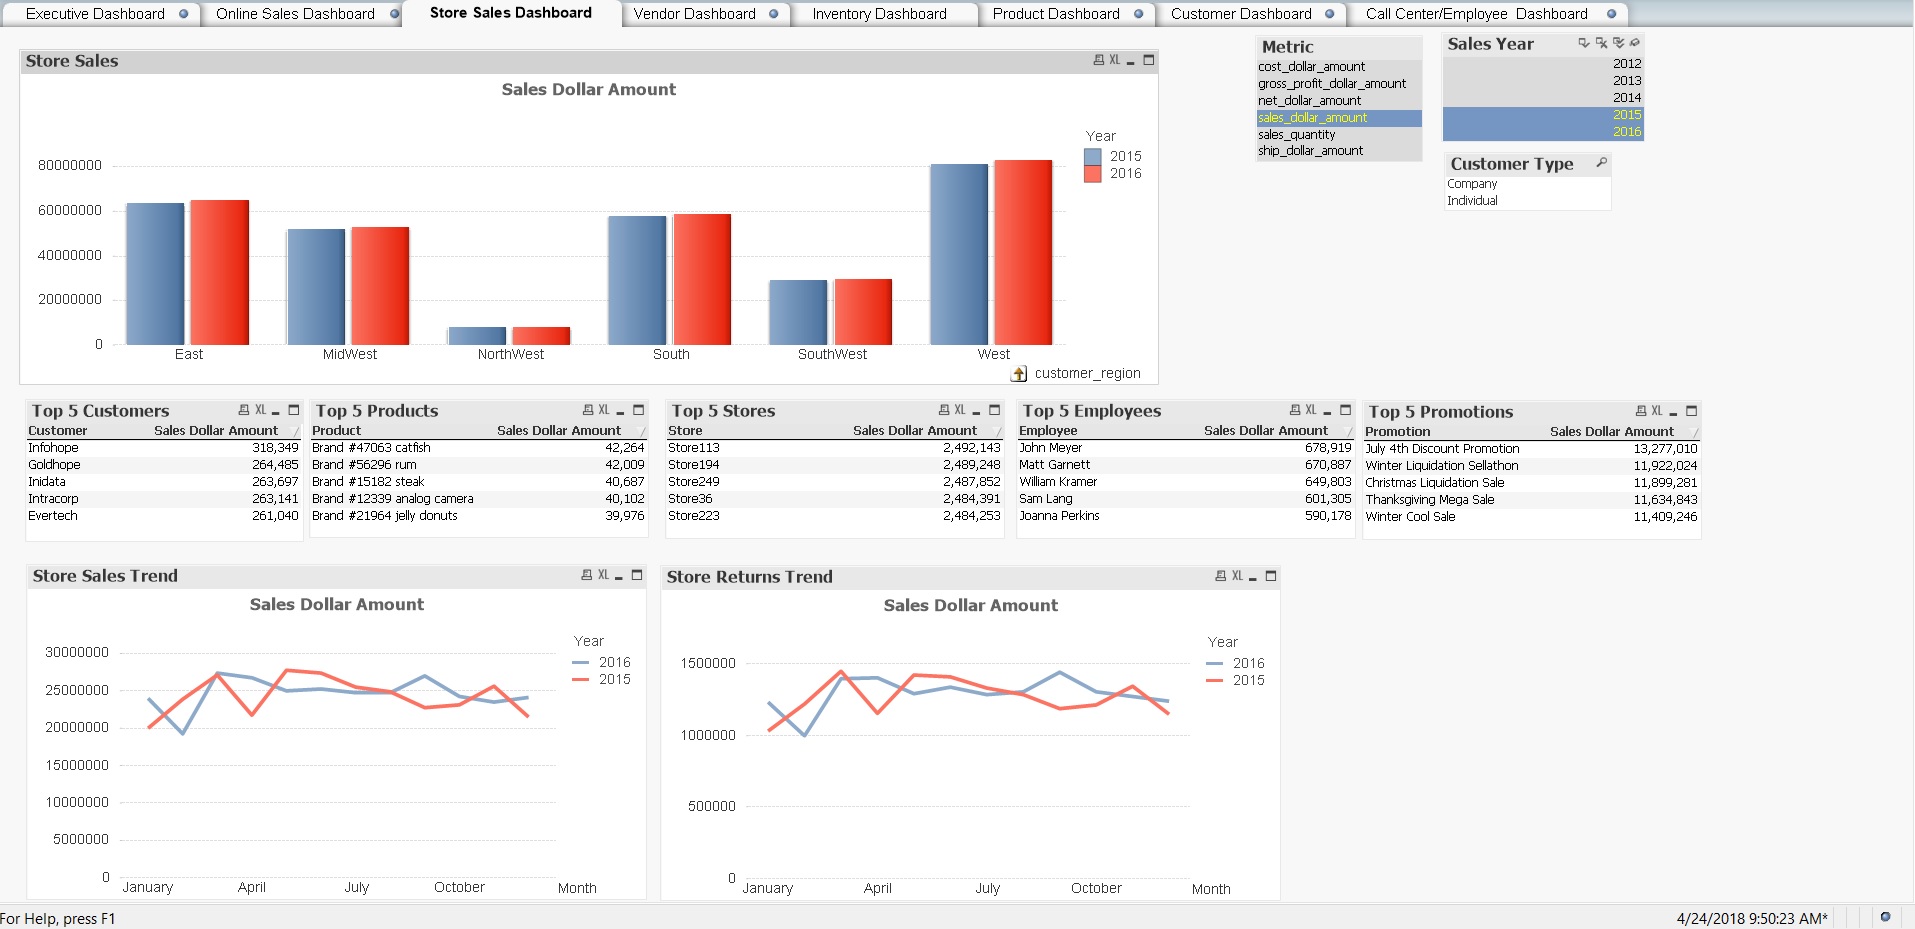
The top store across all regions is shown in the Top 5 Stores pane. If you want to see the top store across all states in the Southwest region, click SouthWest in the Sales Dollar Amount pane. Click the small up arrow to return to the regional level.
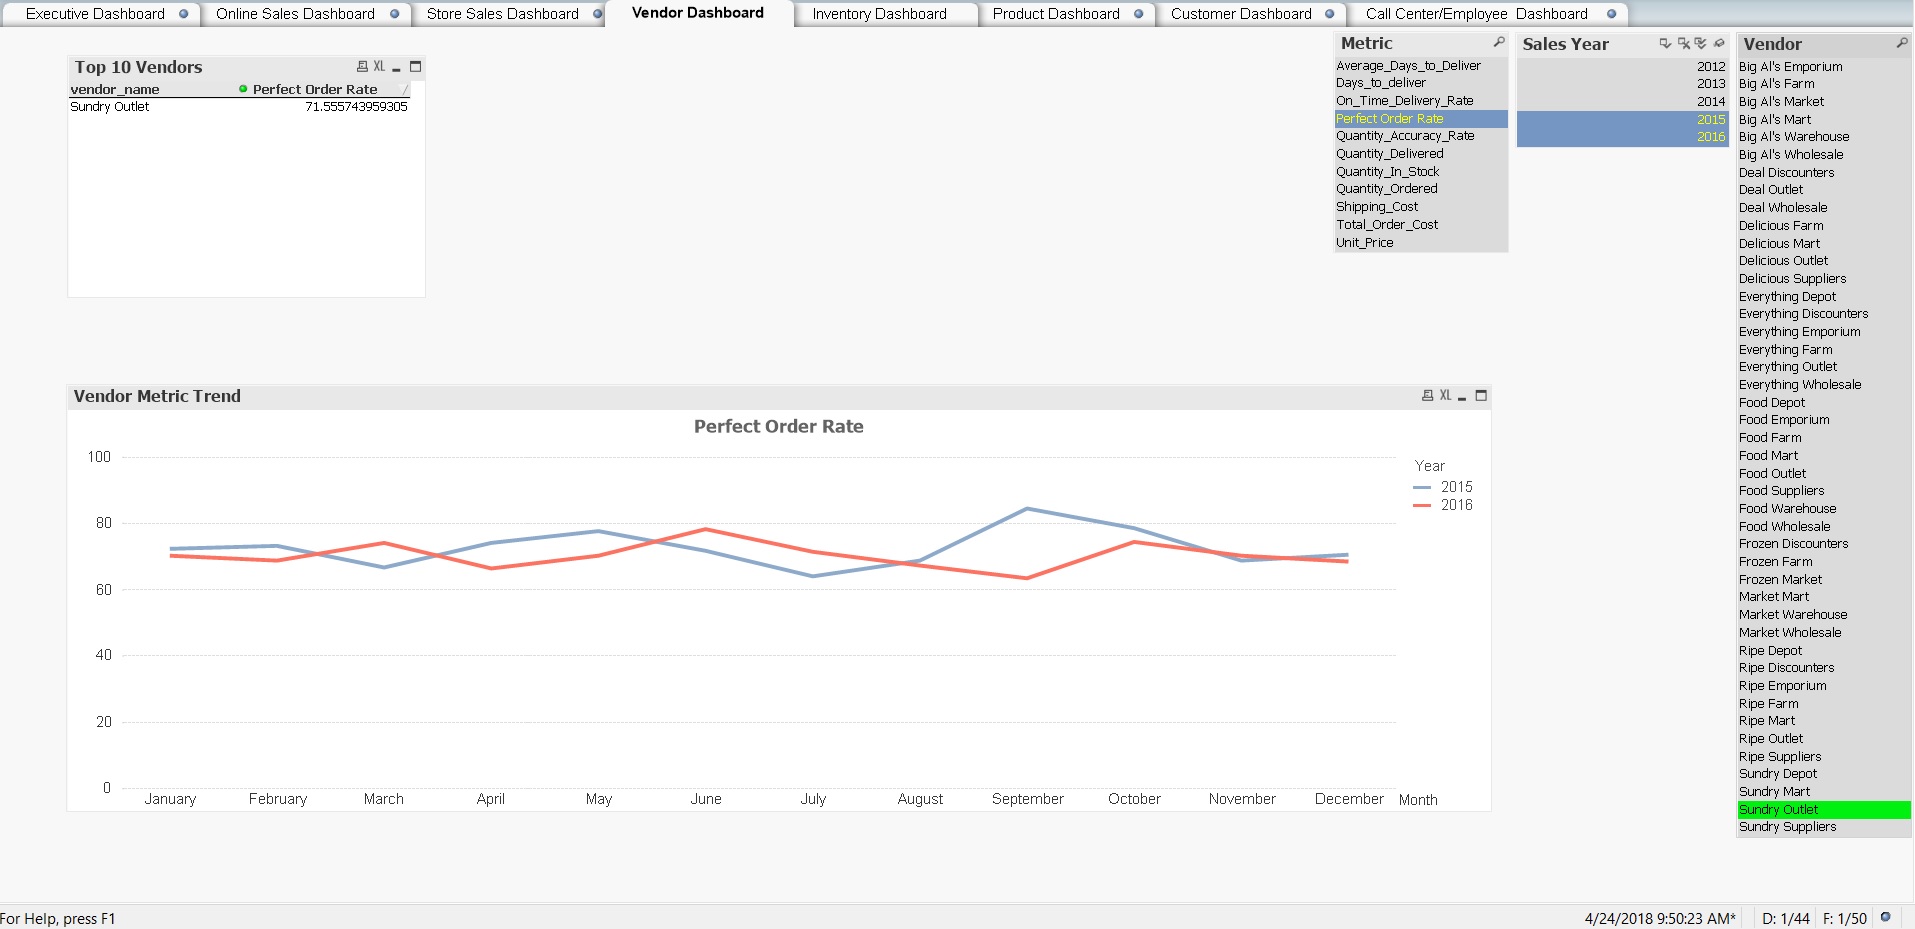
Vendor Dashboard
The Vendor Dashboard displays information about the vendors that sell to this retail chain.
Select Sundry Outlet in the Vendor filter. The following image shows a Perfect Order Rate for Sundry Outlet for 2015 and 2016. The overall rate is about 71%. The line graph shows the fluctuation over the two year period.
Product Dashboard
The Product Dashboard displays information about product sales. In this instance, we are viewing Sales_Dollar_Amount for 2015 and 2016.
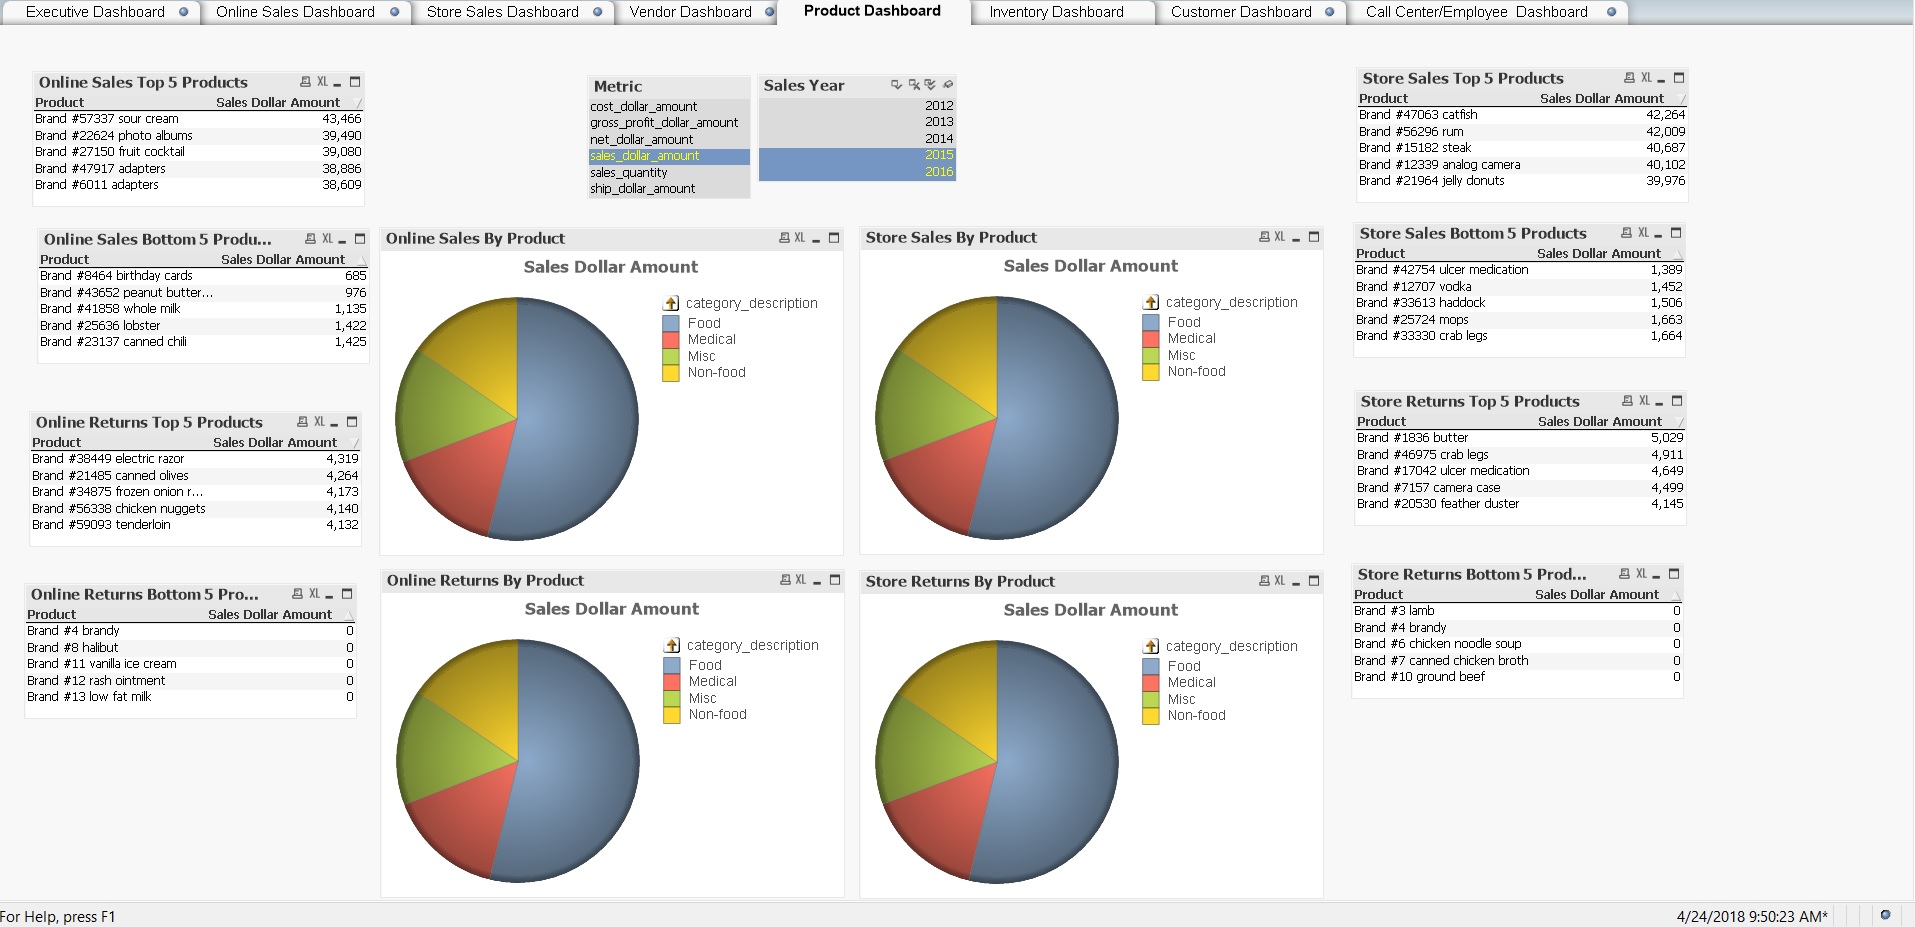
If you click Medical, you will see product sales for the categories of medical products, Medical and Pharmacy. The data will refresh for both online and store sales.

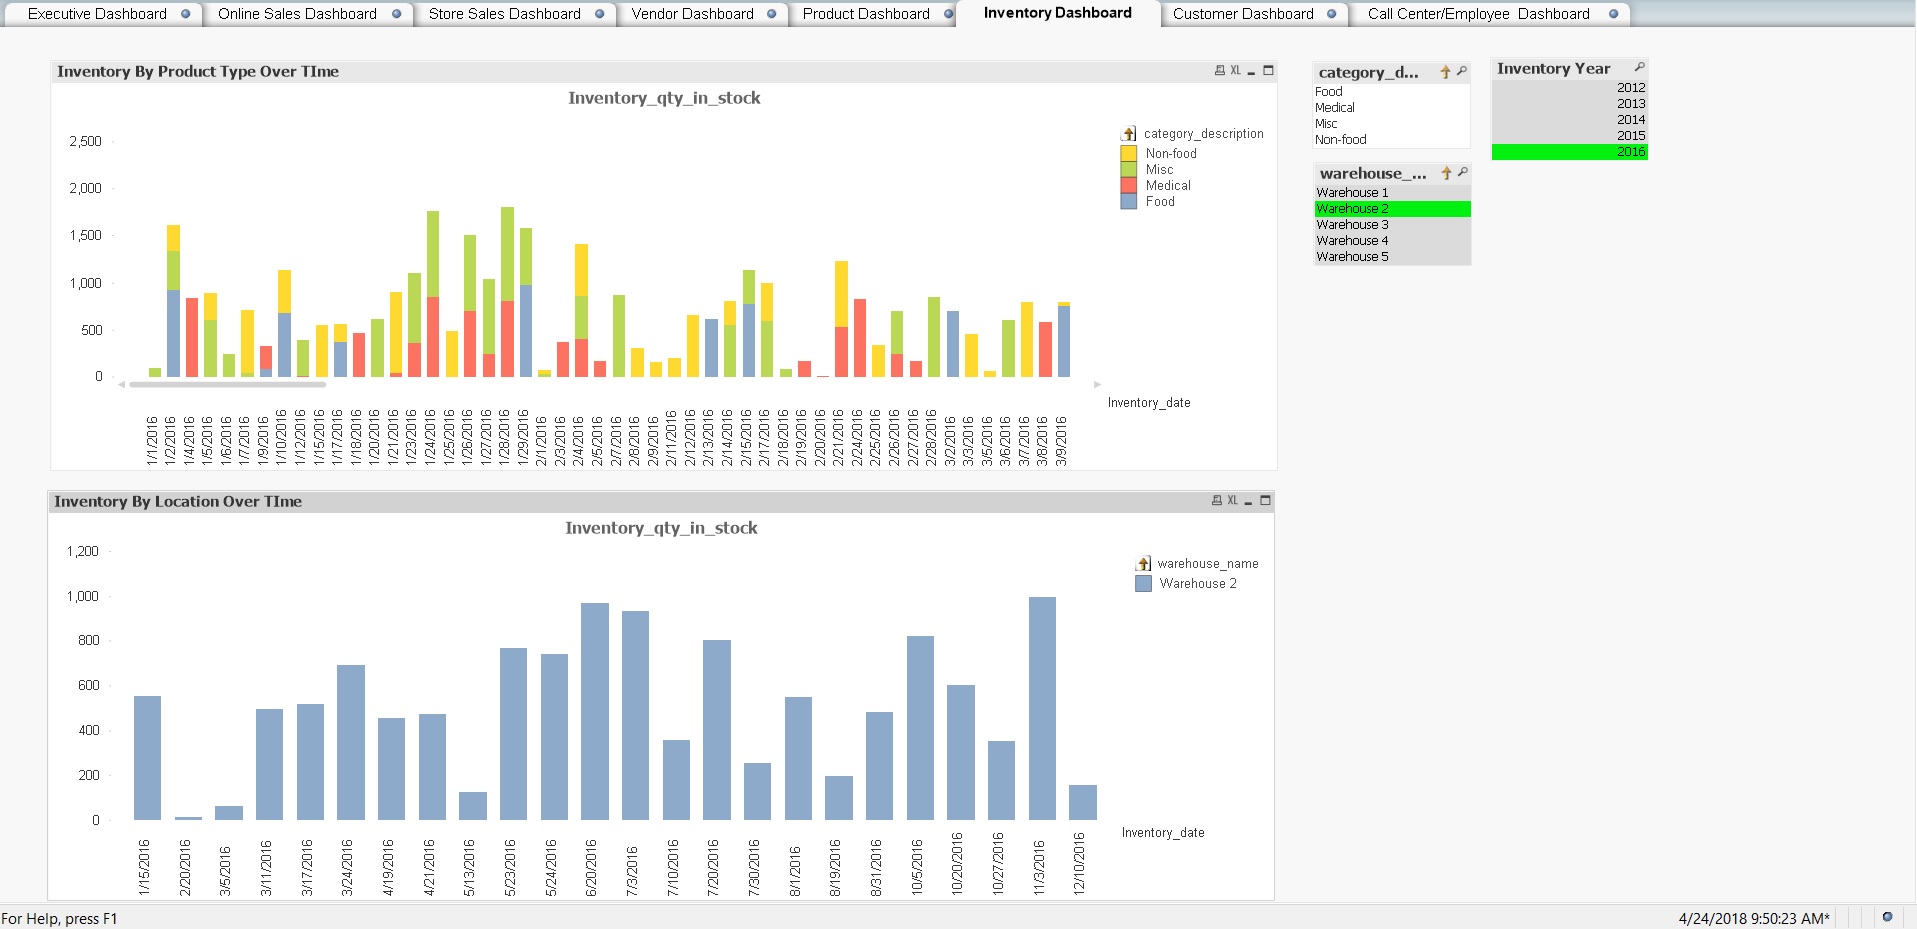
Inventory Dashboard
The Inventory Dashboard displays the quantity of items in stock and by location over time. In this instance, we are viewing the total inventory for all warehouses in 2016.
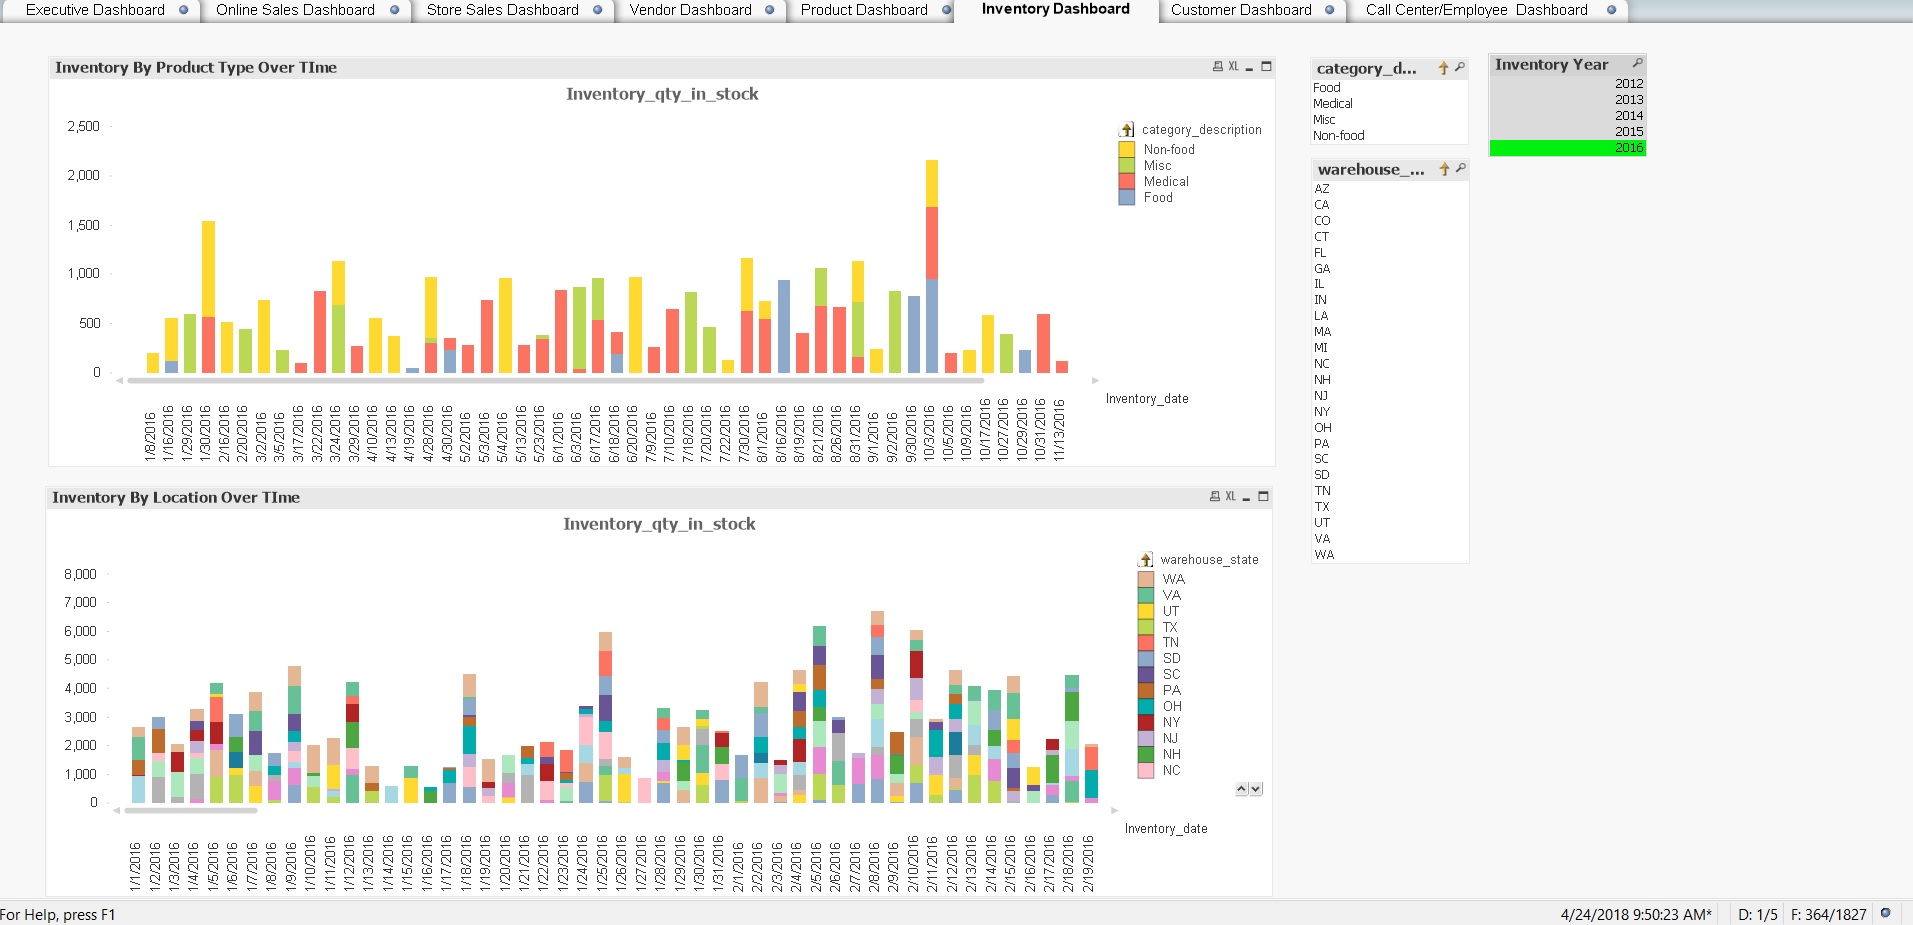
If you drill down on Texas, you will observe the items in inventory in Texas in 2016. If you drill further by clicking Warehouse 2, you will see the items in inventory in Warehouse 2 in Texas in 2016.
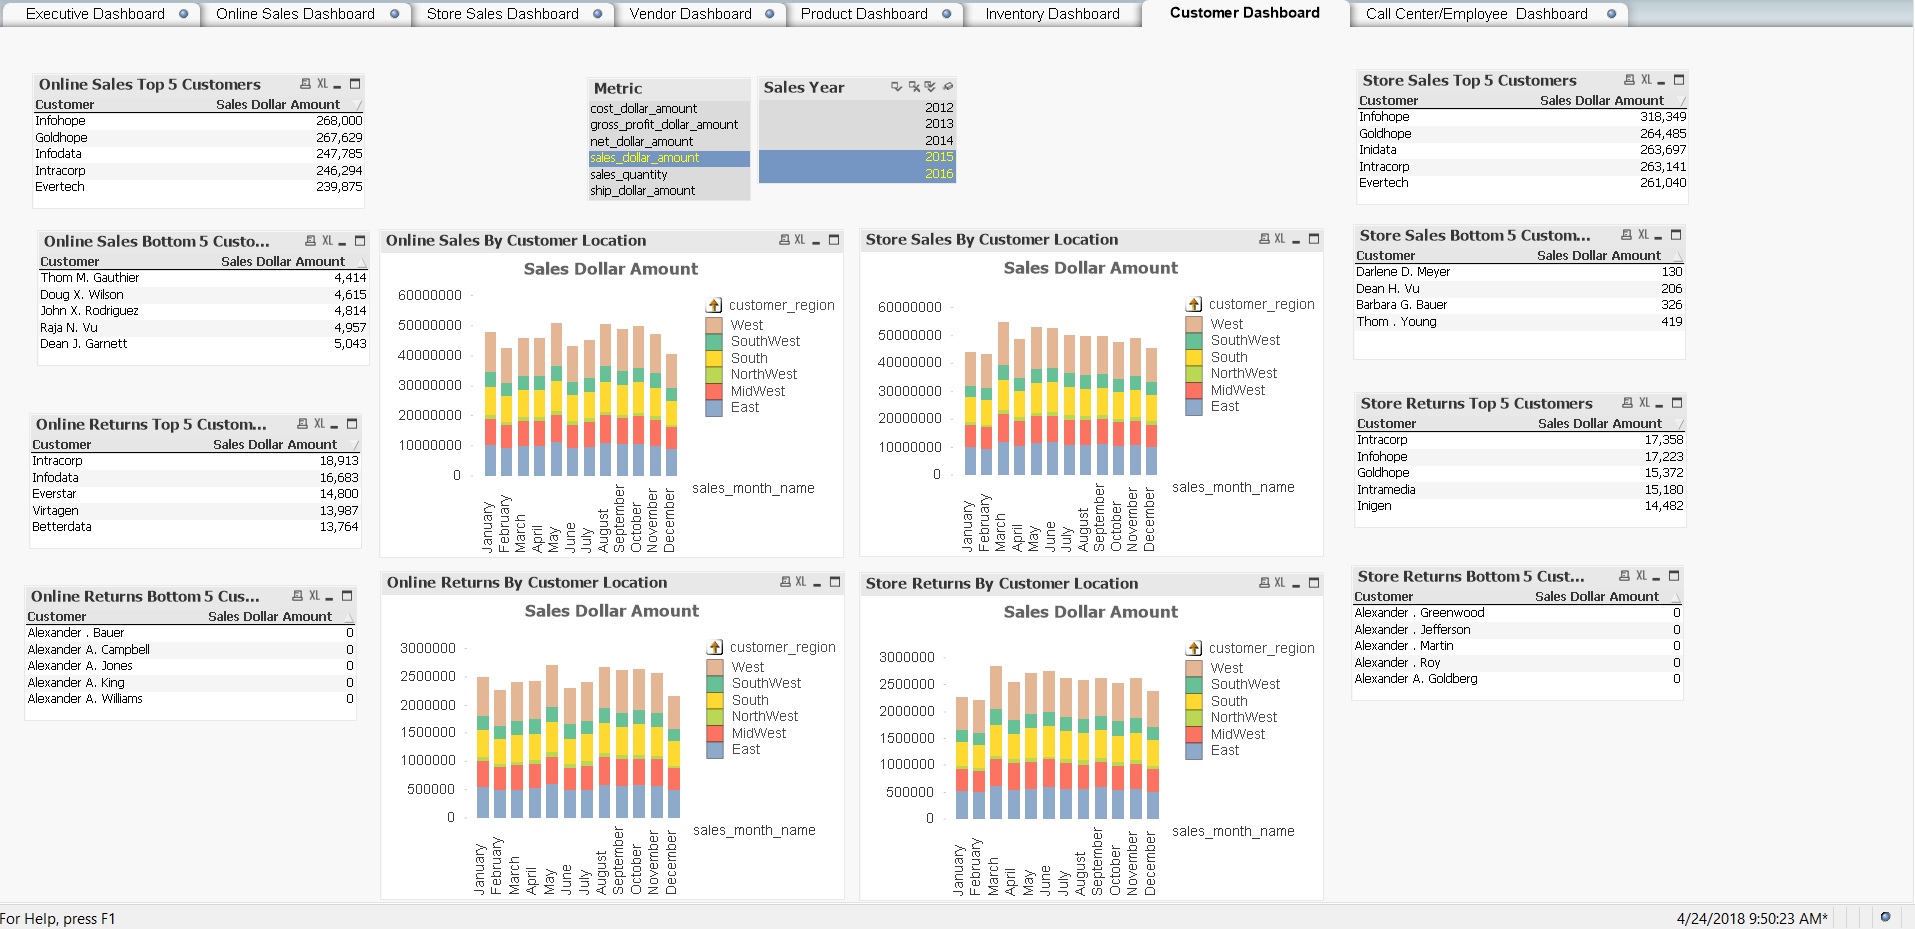
Customer Dashboard
The Customer Dashboard displays information about the customers of this retail chain, both for online and store purchases. In this instance, we are viewing sales data by customer for 2015 and 2016. Click a customer name to view the sales data for that customer.
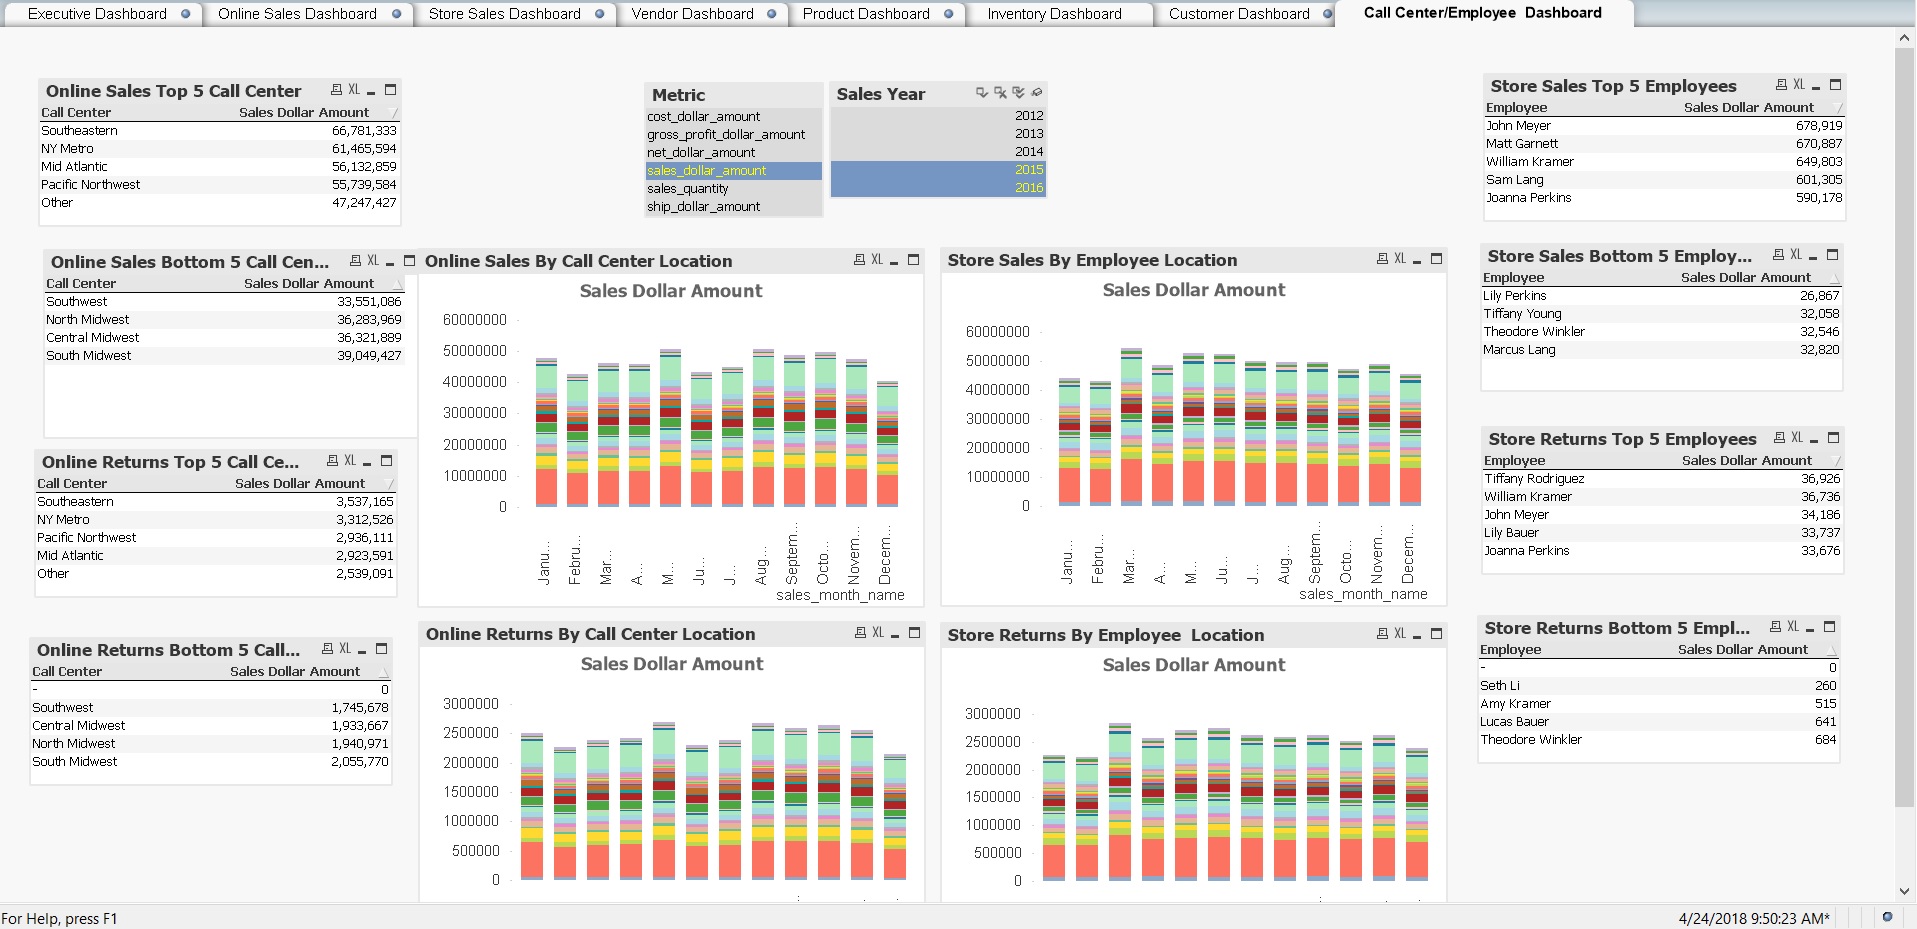
Call Center/Employee Dashboard
The Call Center/Employee Dashboard presents information about sales personnel, both in stores and in call centers for online sales. In this instance, we are viewing the sales data for all sales employees in 2015 and 2016. Click one or more employee names to see the sales data for those individual employees.