Vertica Partner QuickStart for Logi Info: Telecommunications
To read this document in PDF format, click here.
The Vertica Partner QuickStart for Logi Info is a sample BI application implemented as a Logi report powered by the Vertica Analytic Database. The dashboards present sample telecommunications data for analysis. The QuickStart shows how telecommunications companies could use Vertica and Logi to quickly explore, visualize, and gain insight into their data stored in Vertica.
The Telecom QuickStart was developed by Logi Analytics and adapted by the Vertica Partner Engineering team to use Vertica.
You can download the Vertica Partner QuickStart for Logi Info from the following location:
https://www.vertica.com/quickstart/vertica-quickstart-for-logi/
About the Vertica QuickStarts
The QuickStarts are posted for download on the Vertica QuickStart Examples page.
Note The Vertica QuickStarts are freely available for demonstration and educational purposes. They are not governed by any license or support agreements and are not suitable for deployment in production environments.
About Logi Info
Logi Info is a web-based business analytics platform used to rapidly create analytical applications and deploy dashboards and reports. Logi Info works with Windows and Linux operating systems. For detailed product information about Logi Info, see the Logi Analytics website.
Requirements
The Telecom QuickStart requires a Vertica Database Server, the Vertica ADO.Net client driver, Logi Info Studio 12.1.188 or later, and IIS Web services.
The Telecom QuickStart was tested with Logi Info 12.1.188 and Vertica 7.2.x.
Installation and Setup
To install the software that is required for running the QuickStart, follow these steps:
Install Logi Info
- Navigate to the Logi Download page.
- Enter your information to join the community.
- Click Join.
- Follow the installation instructions from Logi Analytics.
Install the Vertica Database Server
Vertica runs on Linux platforms. If you do not already have Vertica, you can download the Community Edition free of charge:
- Navigate to Vertica Community Edition.
- Log in or click Register Now to create an account
- Follow the on-screen instructions to download and install the Vertica Community Edition.
Install the Client Driver
Logi Info uses ADO.NET drivers to connect to Vertica using IIS Web Services. Before you can connect Logi to Vertica, you must download and install the Vertica client package that includes the ADO.NET driver that Logi uses to connect to Vertica. The ADO.NET driver is available as part of the Vertica client drivers package with Vertica 7.2.x and later. For earlier versions, ADO.NET is part of the Vertica Microsoft Connectivity Pack.
To download and install the Vertica client package:
- Go to the Vertica Client Drivers page.
- Download the Vertica client package that matches the version of Vertica that you are using.
- Follow the steps for installing the Vertica client as described in the Vertica documentation.
Note Vertica drivers are forward compatible. You can connect to the Vertica server using previous versions of the client. For more information, see Client Drivers and Server Version Compatibility in the Vertica documentation.
For IIS Web Service: Save the Vertica.Data.dll File
For Logi Info to work with Vertica using the client driver package, you must save the Vertica.Data.dll file you downloaded with the client package into the product bin directory:
- Locate the Vertica jar file from the driver location. For example, a 64-bit driver package installed on a Windows machine is located at:
C:\Program Files\Vertica Systems\ADO.NET\Vertica.Data.dll - Save the dll file into the Logi product bin directory that contains DLLs. For example, the default location on a Windows environment is:
C:\<Application Folder path>\TelecomQS_LogiInfo_ForIIS\bin
Download the QuickStart
- Navigate to vertica.com/quickstart
- Select Vertica Partner QuickStart for Logi Info.
- Log in or create an account.
- Click Download.
Install the Telecom Schema
The Logi application file includes the telecom example DDL files. After you have downloaded and unzipped the QuickStart application into a wwwroot folder, follow these to install the sample schema.
The telecomsolution.zip file contains the following files:
- TelecomQS_forLogi_Create_Schema.sql: Creates the LogiTelecom schema and its objects. This file also contains tables that include:
- cells: Cell tower location details
- concepts
- customersessions: Details about customer-initated sessions
- kpiunits: Key performance indicator units
- networkq: Wireless network data
- regions: City regions
- troubletickets: Network tickets opened
- worldcloud: The words in a Twitter feed
- Twitter:Twitter data
- TelecomQS_forLogi_Load_Data.sql: Loads data into the tables listed previously.
- TelecomQS_forLogi_Drop_Schema.sql: Drops the tables and schema listed previously.
Before you start running the QuickStart application, you must execute these SQL scripts in Vertica. Copy the files into a folder on the machine where you can execute vsql command-line interfaces.
After you invoke vsql, follow these steps:
- Enter the following command:
dbadmin>\i<Directorywherefileexists>\TelecomQS_forLogi_Create_Schema.sql
The tables are created. - Validate the tables that were created:
dbadmin>\d
The following output appears:
- Load the data by executing the load script:
dbadmin>\i <Directorywherefileexists>\ TelecomQS_forLogi_Load_Data.sql - Validate that the rows were loaded into the tables by running the following:
dbadmin> select count(*) from LogiTelecom.cells;dbadmin> select count(*) from LogiTelecom.concepts;dbadmin> select count(*) from LogiTelecom.customersessions;dbadmin> select count(*) from LogiTelecom.kpiunits;dbadmin> select count(*) from LogiTelecom.networkq;dbadmin> select count(*) from LogiTelecom.regions;dbadmin> select count(*) from LogiTelecom.troubletickets;dbadmin> select count(*) from LogiTelecom.twitter;dbadmin> select count(*) from LogiTelecom.wordcloud;If any of these commands return zero rows, check to see if you received an error message while executing the load script. If you dropped objects while troubleshooting, execute the drop schema script (TelecomQS_forLogi_Drop_Schema.sql).
Deploy the Telecom QuickStart Dashboards
You must deploy the zip file into the appropriate folder before you can run sample reports:
IIS Web Service Deployment
- Navigate to the folder where you downloaded the telecomsolution.zip file.
- Unzip the file into a wwwroot folder, such as
C:\inetpub\wwwroot. - Copy your license file from
C:\Program Files\LogiXML IES Devinto the unzipped folder, such asC:\inetpub\wwwroot\telecomsolution. - Open the Logi Info application on your machine.
- You see the application is not registered in the IIS Web Server. Click the Register in IIS link.
- A new wizard appears. Click Next.
- After the application is registered, the following graphic appears. Click Next and then click Finish.
- Under Application click Settings > Path.
- In the bottom left corner of the application, in the Optional Attributes window, change the Application Path based on your web services host name and port number.
- Click Save All.
Modify the Data Source Connection
Before you can deploy the QuickStart example, you must connect the Vertica database to the proper driver, by following these steps:
- Open the Logi Info application.
- Under Application, click Settings > Connections > ConnVerticaLocal_New.
- Enter the following information:
- Vertica Server
- Vertica Database
- Vertica Backup Server
- Vertica User
- Vertica Password
- Vertica Port (default is 5433)
- Vertica Load Balance (enable on the server side also)
4. Click Save All.
Access the QuickStart Dashboards
You can run the dashboards using Logi Info Studio or by using a web browser.
Use Logi Info
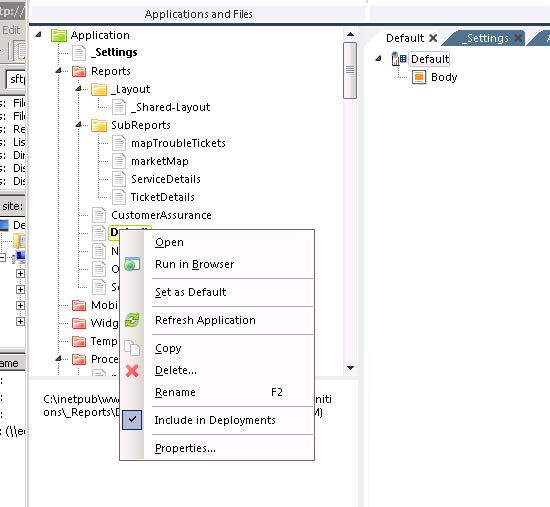
- Under Application, in the Reports folder, select Default.
- Right-click Default and select Run in Browser.
-
Press Enter to see the dashboards.
Use Web Services
To access the dashboards using Web Services, navigate to the following: http://<HostNameorIPAddress:<Port#>/TelecomQS_LogiInfo_forIIS/rdLogon.aspx.
QuickStart Example Dashboards
The QuickStart dashboards present sample wireless network data that a telecom company chain might use to monitor network performance. This could allow the company to minimize the risk of customer churn, which is the amount of time that has elapsed since the customer last interacted with the service. The dashboards also present insight into the views of end-to-end IP based networks to deliver enhanced services.
Main Menu
The Service Assurance dashboard presents a high-level view of the cities within the network you are monitoring. The dashboard appears gray until you click the Simulation button on the bottom left of the dashboard. The simulation shows how the networks are performing in different regions.
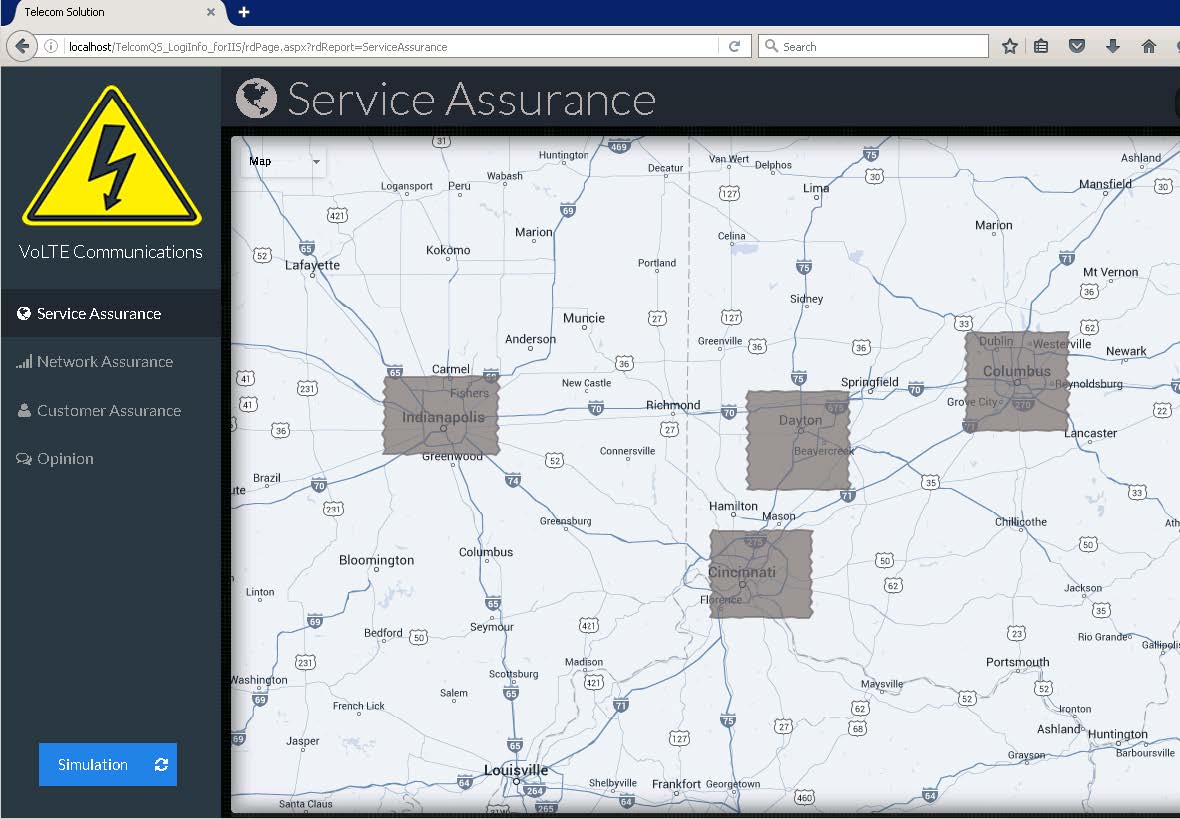
You can drill down further into a region by selecting it. With the simulation running, the regions appear green, orange, or red, to correspond with how well the network is performing. If you select a specific area within a region, you can view data about the network traffic.
Network Assurance Dashboard
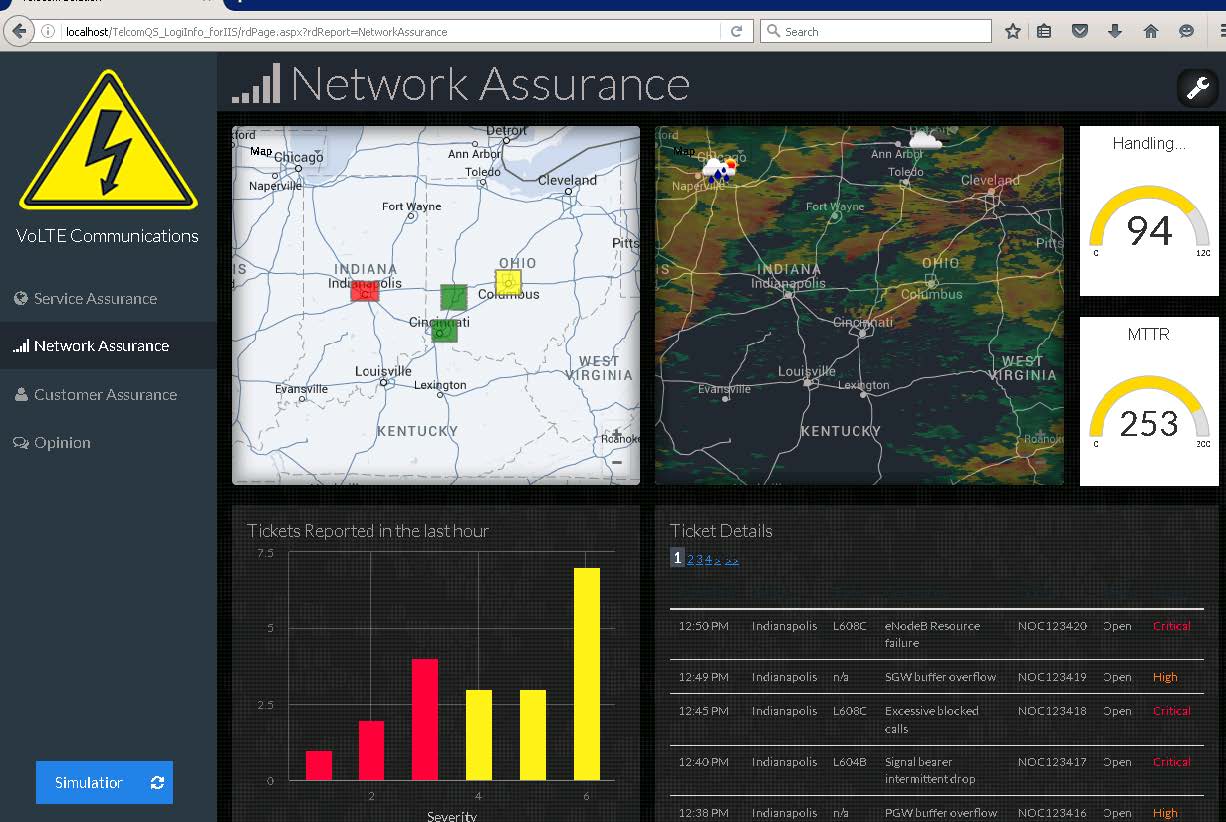
The Network Assurance dashboard contains a weather map, which shows how the weather impacts the networks. Based on weather, you can monitor how many support tickets were reported on an hourly basis.
Customer Assurance Dashboard
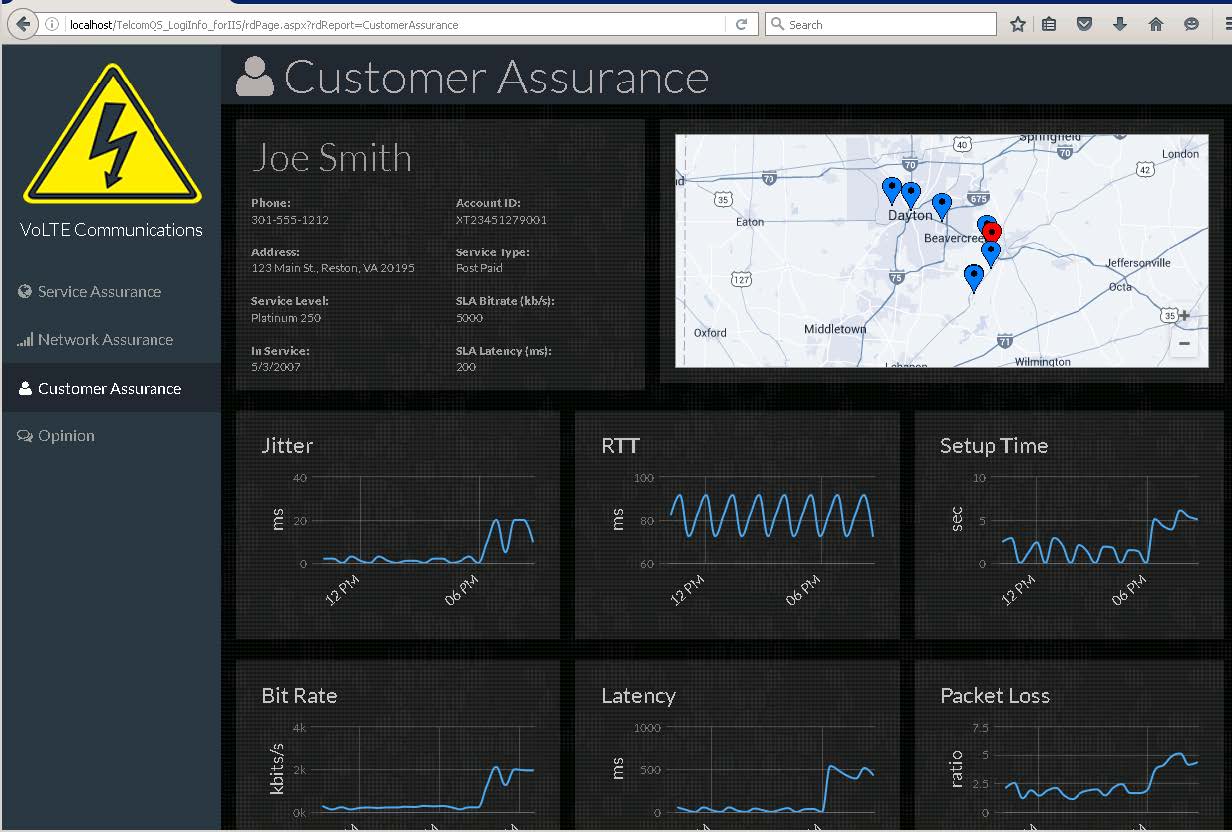
This dashboard provides insight about network utilization information for an individual customer. You can see details about calls that the customer made and see if any of the calls were dropped. The graph on this dashboard shows any variation of delay of packets received (jitter), bit rate, latency, and more.
Opinion Dashboard
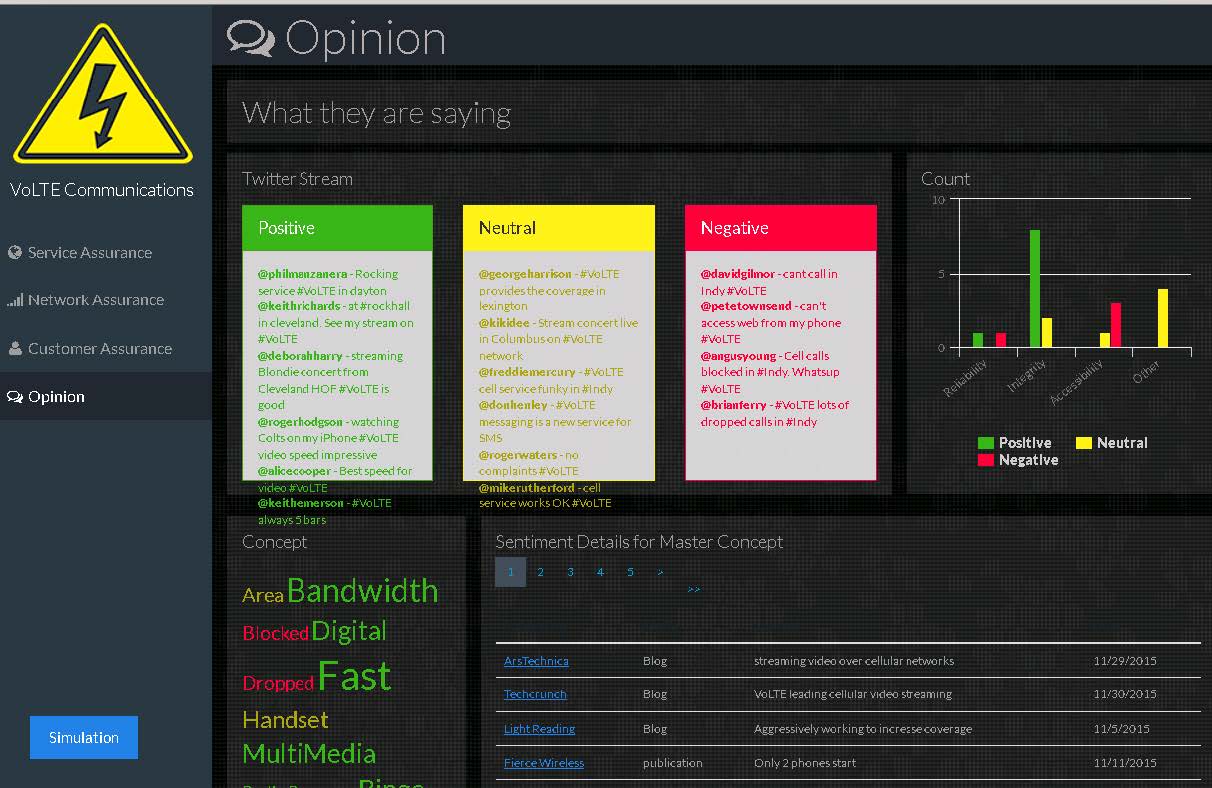
This dashboard provides insights about customer sentiment from Twitter feeds. Press the Simulation button to see if sentiment is positive, negative, or neutral and view what customers are tweeting about.
